Proportion describes a relationship, not an ideal body
Human body proportions compare dimensions within a person or across a defined sample. They can describe the relation of trunk to limbs, arm span to stature, or one limb segment to another. Proportion is different from overall size: two people can have the same standing height and different sitting heights, shoulder breadths, or limb lengths. Conversely, two people can share a ratio while differing substantially in absolute dimensions. These distinctions matter in clinical education, ergonomic planning, imaging interpretation, and respectful communication about individual variation.
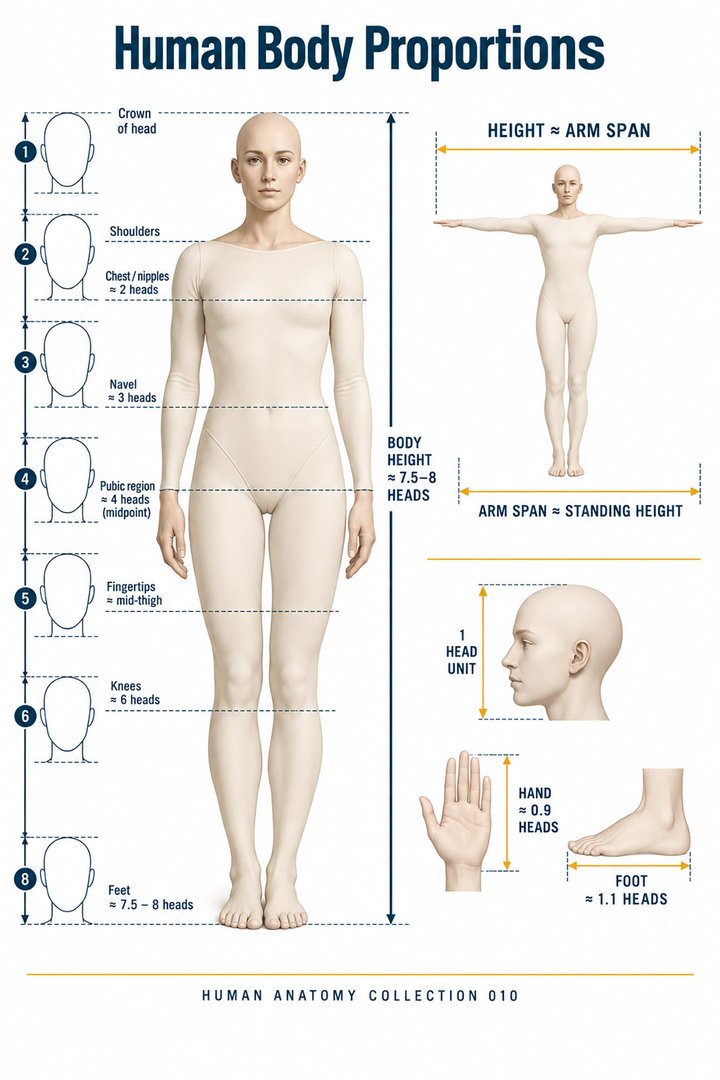
The familiar artistic figure divided into equal “head lengths” is a drawing convention. It can organize a composition but should not become a medical rule or a standard for judging health. Healthcare measurement starts with defined anatomical landmarks and a reproducible procedure. It asks what was measured, how, under which conditions, and against which reference. An idealized silhouette answers a different question. This guide treats proportions as measurable relationships in real bodies rather than as evidence that everyone should fit a single visual template.
Anatomical regions define what is being measured
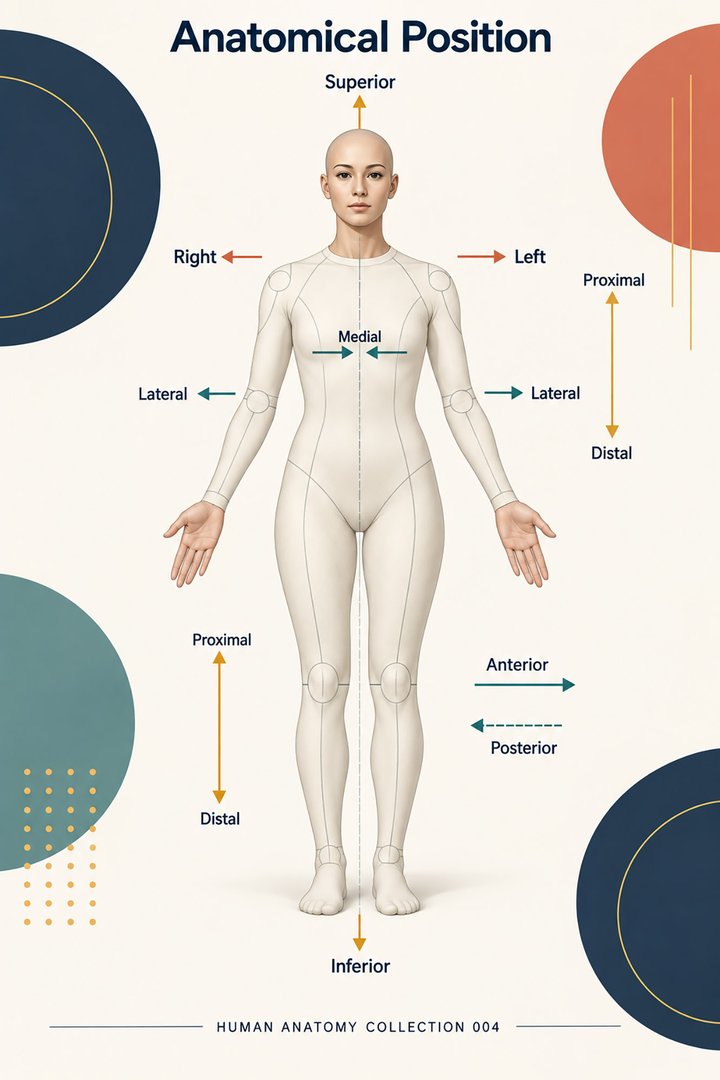
In precise anatomical usage, the arm refers to the region between shoulder and elbow, and the forearm lies between elbow and wrist. The Latin labels brachium and antebrachium distinguish them. Similarly, the thigh and the leg are different regions, although everyday language often uses “leg” for the entire lower limb. A measurement called upper-arm length should not be treated as a measurement from shoulder to fingertips. A lower-limb measurement should identify its endpoints rather than relying on an everyday regional name.
The distinction is more than vocabulary. If a chart compares humeral length, external upper-arm length, and total arm span, it is comparing different anatomical quantities. A bone measurement and a surface measurement may use different landmarks and include different tissues. A learner should therefore define the dimension before calculating a ratio. If two data sources use different endpoints, numerical agreement may be accidental and numerical disagreement may be expected. Precise anatomy provides the first safeguard against misleading quantitative comparisons.
Stature and sitting height answer different questions
Stature describes standing height under a defined procedure. Sitting height concerns a seated vertical dimension and supplies information about the head-and-trunk contribution relative to the whole body's standing dimension. Arm span and trunk-to-limb comparisons add other aspects of body habitus. None can be inferred perfectly from a single overall measurement. NCBI Clinical Methods: Body size and habitus
An original example uses two hypothetical people who are both 170 centimeters tall. One has a sitting-height value of 88 centimeters and the other 92 centimeters under the same defined protocol. The sitting-height ratios are approximately 0.518 and 0.541. These numbers are invented teaching values, not reference limits. They demonstrate the mathematical point that equal stature does not imply equal proportional arrangement. A graphic can display equal total-height bars with different head-and-trunk portions while clearly labeling the illustration as hypothetical.
A standardized procedure turns a dimension into useful data
Anthropometry depends on equipment, positioning, landmarks, and quality control. NHANES III training materials distinguish measurements such as standing height, recumbent length, sitting height, limb dimensions, circumferences, and breadths. They are recorded using defined procedures so that observations can be compared within a survey and across appropriately aligned studies. CDC NHANES: Standardized anthropometric procedures
For a practice exercise, ask two learners to measure the same modeled dimension independently, then compare not only the results but the method. Did they use the same endpoints? Was the subject positioned the same way? Did one include shoes or hair height? Was the measuring surface aligned consistently? The exercise should emphasize reproducibility rather than competitiveness. A result with more decimal places is not automatically more accurate. The number of reported digits should reflect the resolution and reliability of the method, not a desire to make an ordinary observation appear more scientific.
Ratios require a named numerator and denominator
An arm-span-to-stature ratio divides the first dimension by the second using the same units. A sitting-height-to-stature ratio does the same for a different anatomical relationship. A ratio without its numerator and denominator is ambiguous. Reversing the order changes the number, so “height-span ratio” and “span-height ratio” should not be casually substituted for one another. A difference, measured in centimeters, also answers a different question from a dimensionless ratio.
Take a hypothetical stature of 170 centimeters and arm span of 176 centimeters. The arm-span-to-stature ratio is about 1.035; the span-minus-stature difference is 6 centimeters. If the ratio is reversed, 170 divided by 176 is about 0.966. None of these arithmetic results is intrinsically wrong, but each needs its label. An infographic that displays only “1.035” loses the anatomical meaning. A clinical or educational record should keep the original dimensions visible so that a later reader can verify the calculation and interpret the chosen convention.
Arm span is associated with height, not identical to it
A 2020 study of 400 Khasi adult volunteers aged 25–45 years included 272 men and 128 women. It reported male mean stature of 159.68 centimeters and mean arm span of 166.30 centimeters, and female means of 149.96 and 155.77 centimeters respectively. These results illustrate a sample-specific relationship in which the average span exceeded average stature. They do not establish a universal equation for all ages, populations, or individuals. Sarma et al.: Arm span and height in Khasi adults, 2020
A separate study measured sitting height, standing height, arm span, and leg lengths in 505 South Indian women aged 20–29. Its comparisons showed that relationships among dimensions differed; correlation with one dimension did not mean identical information about every other dimension. Mohanty et al.: Body dimensions in 505 South Indian women, 2001
These examples are useful precisely because they resist the popular claim that arm span always equals height. Correlation means that dimensions tend to vary together within the studied data. It does not make every individual's values equal, and it does not justify applying a sample's predictive equation without considering its population and uncertainty. Healthcare learners should separate a helpful proxy from a direct measurement.
Averages describe a sample rather than a universal template
CDC FastStats reports measured average stature for U.S. adults aged 20 and older of 68.9 inches for men and 63.5 inches for women, citing data collected from August 2021 through August 2023. Converting inches to centimeters gives approximately 175.0 and 161.3 centimeters. These are U.S. survey averages for defined groups and dates, not global constants or desired personal dimensions. CDC: Measured adult body dimensions
The underlying reference report includes distributions and additional measurements rather than treating the mean as a complete description of body shape. Survey methods and included groups matter when interpreting those summaries. CDC: Anthropometric reference data, United States, August 2021–August 2023
An average height can inform a discussion of scale, but it does not identify average arm length, average reach, or average sitting height for the same individual. A single hypothetical “average person” assembled from several unrelated averages may correspond to no actual member of the sample. This matters when educational illustrations move from depicting representative anatomy to claiming precise proportional dimensions. The illustrator should state the purpose and avoid presenting the drawing as a population measurement.
Percentiles concern one defined dimension
A percentile locates a value within a distribution for a specified population and measurement. A person near one percentile for stature need not occupy the same percentile for shoulder breadth or reach. NASA's human-design guidance also warns that separate segment percentiles cannot simply be added to produce the percentile of a combined dimension. A fifth-percentile forearm and fifth-percentile upper arm do not automatically define a fifth-percentile whole arm. NASA: Human Integration Design Handbook
The logical reason is that dimensions vary jointly, and the people contributing the lower values in one measurement are not necessarily the same people contributing lower values in another. This is a useful statistical lesson for healthcare learners because it prevents shorthand such as “a fifth-percentile person” from obscuring actual variation. The person has multiple dimensions, each with its own location in a relevant distribution. A chart should identify the measured variable and reference group every time it uses a percentile label.
Children's proportions must be interpreted through growth
Children are not simply scaled-down adults. Growth changes overall dimensions and relationships among body regions. Growth charts describe distributions of selected measurements by age and other reference characteristics. CDC emphasizes that the charts contribute to an overall health picture and are not intended as a sole diagnostic instrument. CDC: Growth charts
Recumbent length and standing stature are different measurement conditions, and moving between growth references or measurement approaches can alter percentile classification. Serial measurements provide context that a single isolated point cannot supply. CDC: Using WHO growth standard charts
For an educational illustration, compare two age-specific outlines without asserting one universal ratio for every child. Label the figures as schematics and identify the dimensions being discussed. Avoid comparing a child's proportion directly with an adult artistic convention and treating the difference as abnormal. The appropriate question is how the measured relationship fits the individual's age, history, method, and broader assessment. This is a scientific and respectful way to discuss variation without using a drawing as a diagnosis.
Posture affects the dimension available to measurement
A measurement is a relationship between anatomical landmarks under particular positioning conditions. Changing posture can change the distance between external points, the ease of locating a landmark, or the ability to achieve a standardized position. A photograph may also distort proportions through camera angle, perspective, and lens characteristics. Therefore a visual estimate from an ordinary image should not be treated as equivalent to a standardized anthropometric measurement.
In older-person care, mobility limits or difficulty maintaining a position can make measurement context especially important. The useful response is to record what was measured and how, rather than silently substitute a different method and preserve the same label. If an alternative dimension is used as a proxy, its status should remain visible. This is a documentation principle, not a recommendation for a particular clinical equation. It allows colleagues to compare observations appropriately and prevents a change in technique from being misread as a change in the person's body.
Proportions matter for practical fit and movement
Anthropometric information can help determine whether a person can reach, fit within, or move safely around an environment. NASA's anthropometry and biomechanics work explicitly considers shape and performance, recognizing that proportions can create fit problems even when minimum and maximum overall dimensions appear acceptable. NASA: Anthropometry and biomechanics
The principle transfers readily to healthcare education. Two equally tall people may differ in seated eye level, forearm support position, or comfortable reach. A one-size diagram of a workstation therefore cannot establish that it fits everyone of that height. An original exercise is to use adjustable paper or digital segments to vary trunk and limb proportions while keeping total stature constant. Ask which interfaces change: seat, work surface, control position, or clearance. The exercise connects proportional anatomy with real environmental constraints without reducing the person to one numerical category.
Population context must travel with a dataset
NASA's published anthropometric datasets concern defined design populations and may include projections from earlier surveys. They also discuss conditions such as clothing, protective equipment, posture, and microgravity-related spinal changes. Such data are valuable for their intended purpose but are not a generic reference for every healthcare population. NASA: Anthropometric datasets and population context
This illustrates a broader evidence rule: retain the population, date, and measurement context when reusing numerical dimensions. A study of young adults cannot automatically become a reference for children or frail older adults. A workplace-specific sample may omit groups whose dimensions differ. A sample mean tells the reader about that sample; a design allowance tells the reader about a planned accommodation. The two may use similar numbers while answering different questions. Keeping those questions explicit makes proportional data more useful and prevents a chart from borrowing authority it has not earned.
Symmetry and asymmetry are distinct from overall proportion
Comparing right and left limb dimensions can provide information about symmetry, but a side-to-side comparison is not the same as a trunk-to-limb ratio. The first compares corresponding regions; the second compares different regions. Both require consistent landmarks and units. External symmetry also does not imply that internal organs are mirror images. A general anatomy silhouette should therefore avoid suggesting that proportional balance on the surface reproduces the arrangement of every internal structure.
An original measurement exercise separates three records: total size, within-body ratio, and right-left difference. A student may discover that two hypothetical bodies share the same total stature, differ in sitting-height ratio, and share a small side-to-side measurement difference. This makes the independence of the questions visible. It also discourages vague statements such as “the body is out of proportion,” which hide the actual dimension and comparison. Clear quantitative language is more respectful and more informative than a judgment based on an idealized drawing.
Ratios can conceal changes in their components
A ratio may remain constant while both dimensions change together. It may also change because the numerator changes, the denominator changes, or both change differently. For example, a hypothetical span-height ratio rising from 1.00 to 1.03 does not by itself tell the reader whether arm span increased, stature decreased, or the measurements were taken differently. The original values and methods are therefore essential. Derived numbers should supplement raw observations rather than replace them entirely.
For a numerical demonstration, compare two hypothetical pairs: 160 and 160 centimeters, then 176 and 176 centimeters. Both ratios equal one despite a 16-centimeter difference in each absolute dimension. Next hold span at 176 centimeters and change stature to 170 centimeters; the ratio rises although span has not changed. These scenarios are arithmetic illustrations, not growth predictions or clinical classifications. A useful graphic shows the component bars beside the ratio so that the reader can see how the same summary can arise from different underlying dimensions.
Reading body proportion data responsibly
Begin with the anatomical definition, then identify the measurement procedure and units. Determine whether the result is a direct dimension, a ratio, a difference, an estimate, or a percentile. Check the reference population and dates before comparing it with another source. Finally, distinguish an educational observation from an individual clinical interpretation. These steps retain the value of quantitative anatomy without turning a single number into a universal judgment about a person's health or function.
A complete teaching graphic should show landmarks, the direction of measurement, the numerator and denominator if relevant, and whether the values are observed or hypothetical. Real photographs can illustrate anatomy and positioning, but they should not invite unsupported measurements from perspective-distorted images. Body proportions become most useful when they describe the diversity and organization of real people. For medical students, practice staff, hospital teams, and older-person care colleagues, the goal is accurate comparison, reproducible documentation, and environments or explanations that accommodate individual bodies rather than demand conformity to an artistic ideal.
Anatomical Latin: quick reference
| Latin term | English meaning |
|---|---|
| Caput | Head |
| Truncus | Trunk |
| Membrum superius | Upper limb |
| Membrum inferius | Lower limb |
Sources and image credits
Sources reviewed on 9 October 2026. Counts, estimates, study statistics and hypothetical calculations retain their context in the text.
- NCBI Clinical Methods: Body size and habitus
- CDC NHANES: Standardized anthropometric procedures
- Sarma et al.: Arm span and height in Khasi adults, 2020
- Mohanty et al.: Body dimensions in 505 South Indian women, 2001
- CDC: Measured adult body dimensions
- CDC: Anthropometric reference data, United States, August 2021–August 2023
- NASA: Human Integration Design Handbook
- CDC: Growth charts
- CDC: Using WHO growth standard charts
- NASA: Anthropometry and biomechanics
- NASA: Anthropometric datasets and population context
Explanatory prose and SVG graphics are original. Photograph authors, source records and licenses are credited beside each image. Catalog illustrations provide educational context; anatomical facts are supported by the linked sources.