Density is one window into living bone
Bone density is often discussed as though it were a single measure of skeletal health. In reality, bone is living tissue whose strength depends on mineral, collagen, microscopic architecture, size, and the forces applied to it. Bone mineral density provides valuable information about the mineral component, but it cannot describe every factor that determines whether a bone will fracture. This distinction matters when explaining results to patients or discussing them in a clinical team. A person can have an important fracture risk even when one density measurement does not fall into a particular diagnostic category. NIAMS: Osteoporosis describes the relationship between bone mass, structure, and strength.
For medical students, density is an opportunity to link histology with biomechanics and measurement. For practice assistants and hospital staff, familiarity with the terms helps prevent mistakes in appointment preparation, reporting, and communication. For older-person care, the practical outcome is maintaining safe function and recording relevant changes, not assigning a score to every difficulty with mobility. The useful starting question is what has actually been measured. Is the result a mineral amount, an areal density, a comparison with a reference population, or a clinical estimate of future fracture risk? These related quantities have different units and different meanings.
Mineral and collagen contribute different properties
The extracellular matrix of bone contains mineral crystals and an organic framework rich in collagen. The mineral component contributes stiffness, while the organic framework helps the tissue resist forces without behaving like a simple brittle ceramic. Most body calcium is stored in bones and teeth; the NIH Office of Dietary Supplements describes this proportion as more than 99 percent. This number refers to the location of the body's calcium, not to the percentage of a bone that is made of calcium. Confusing those two statements produces a dramatically incorrect description of bone composition. See NIH ODS: Calcium.
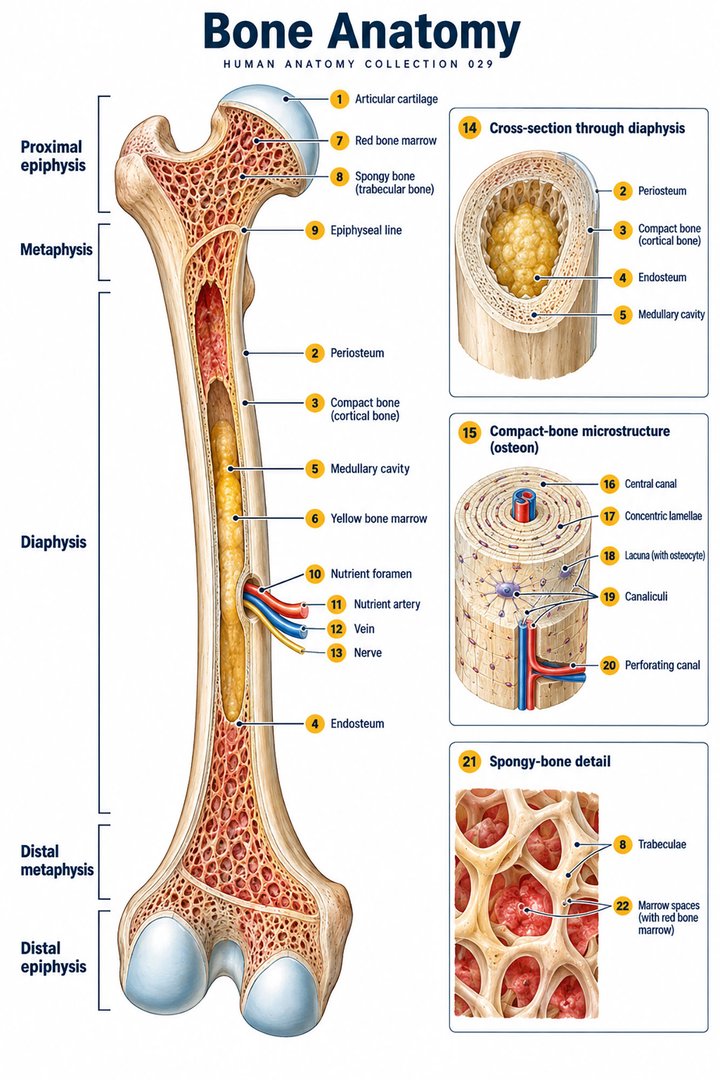
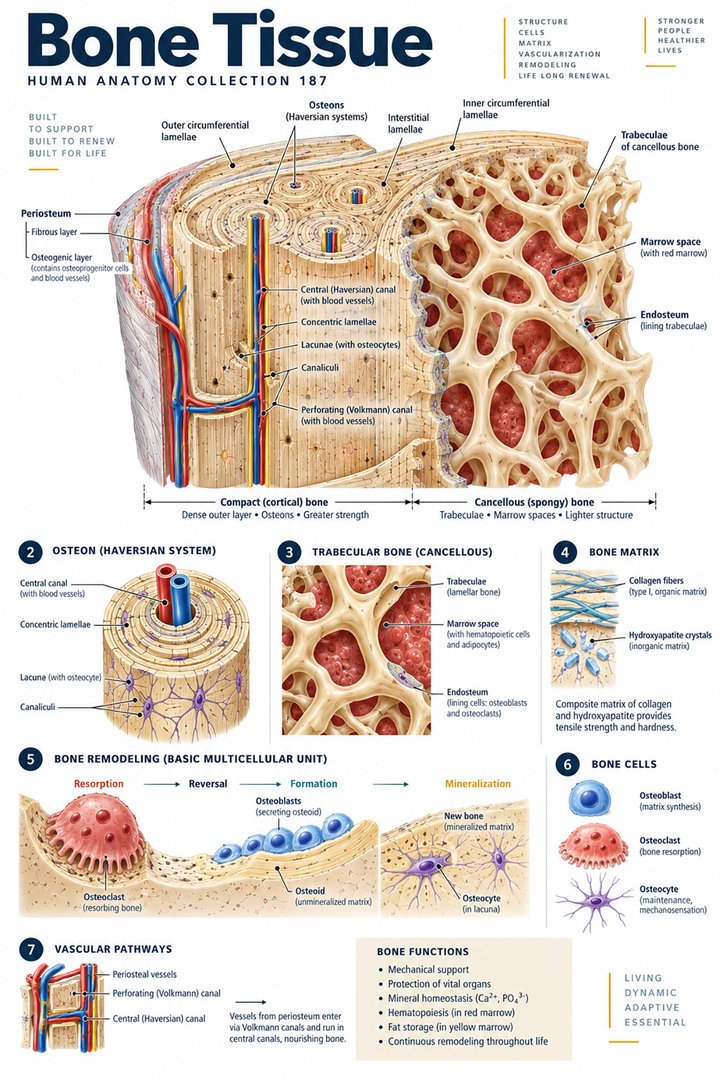
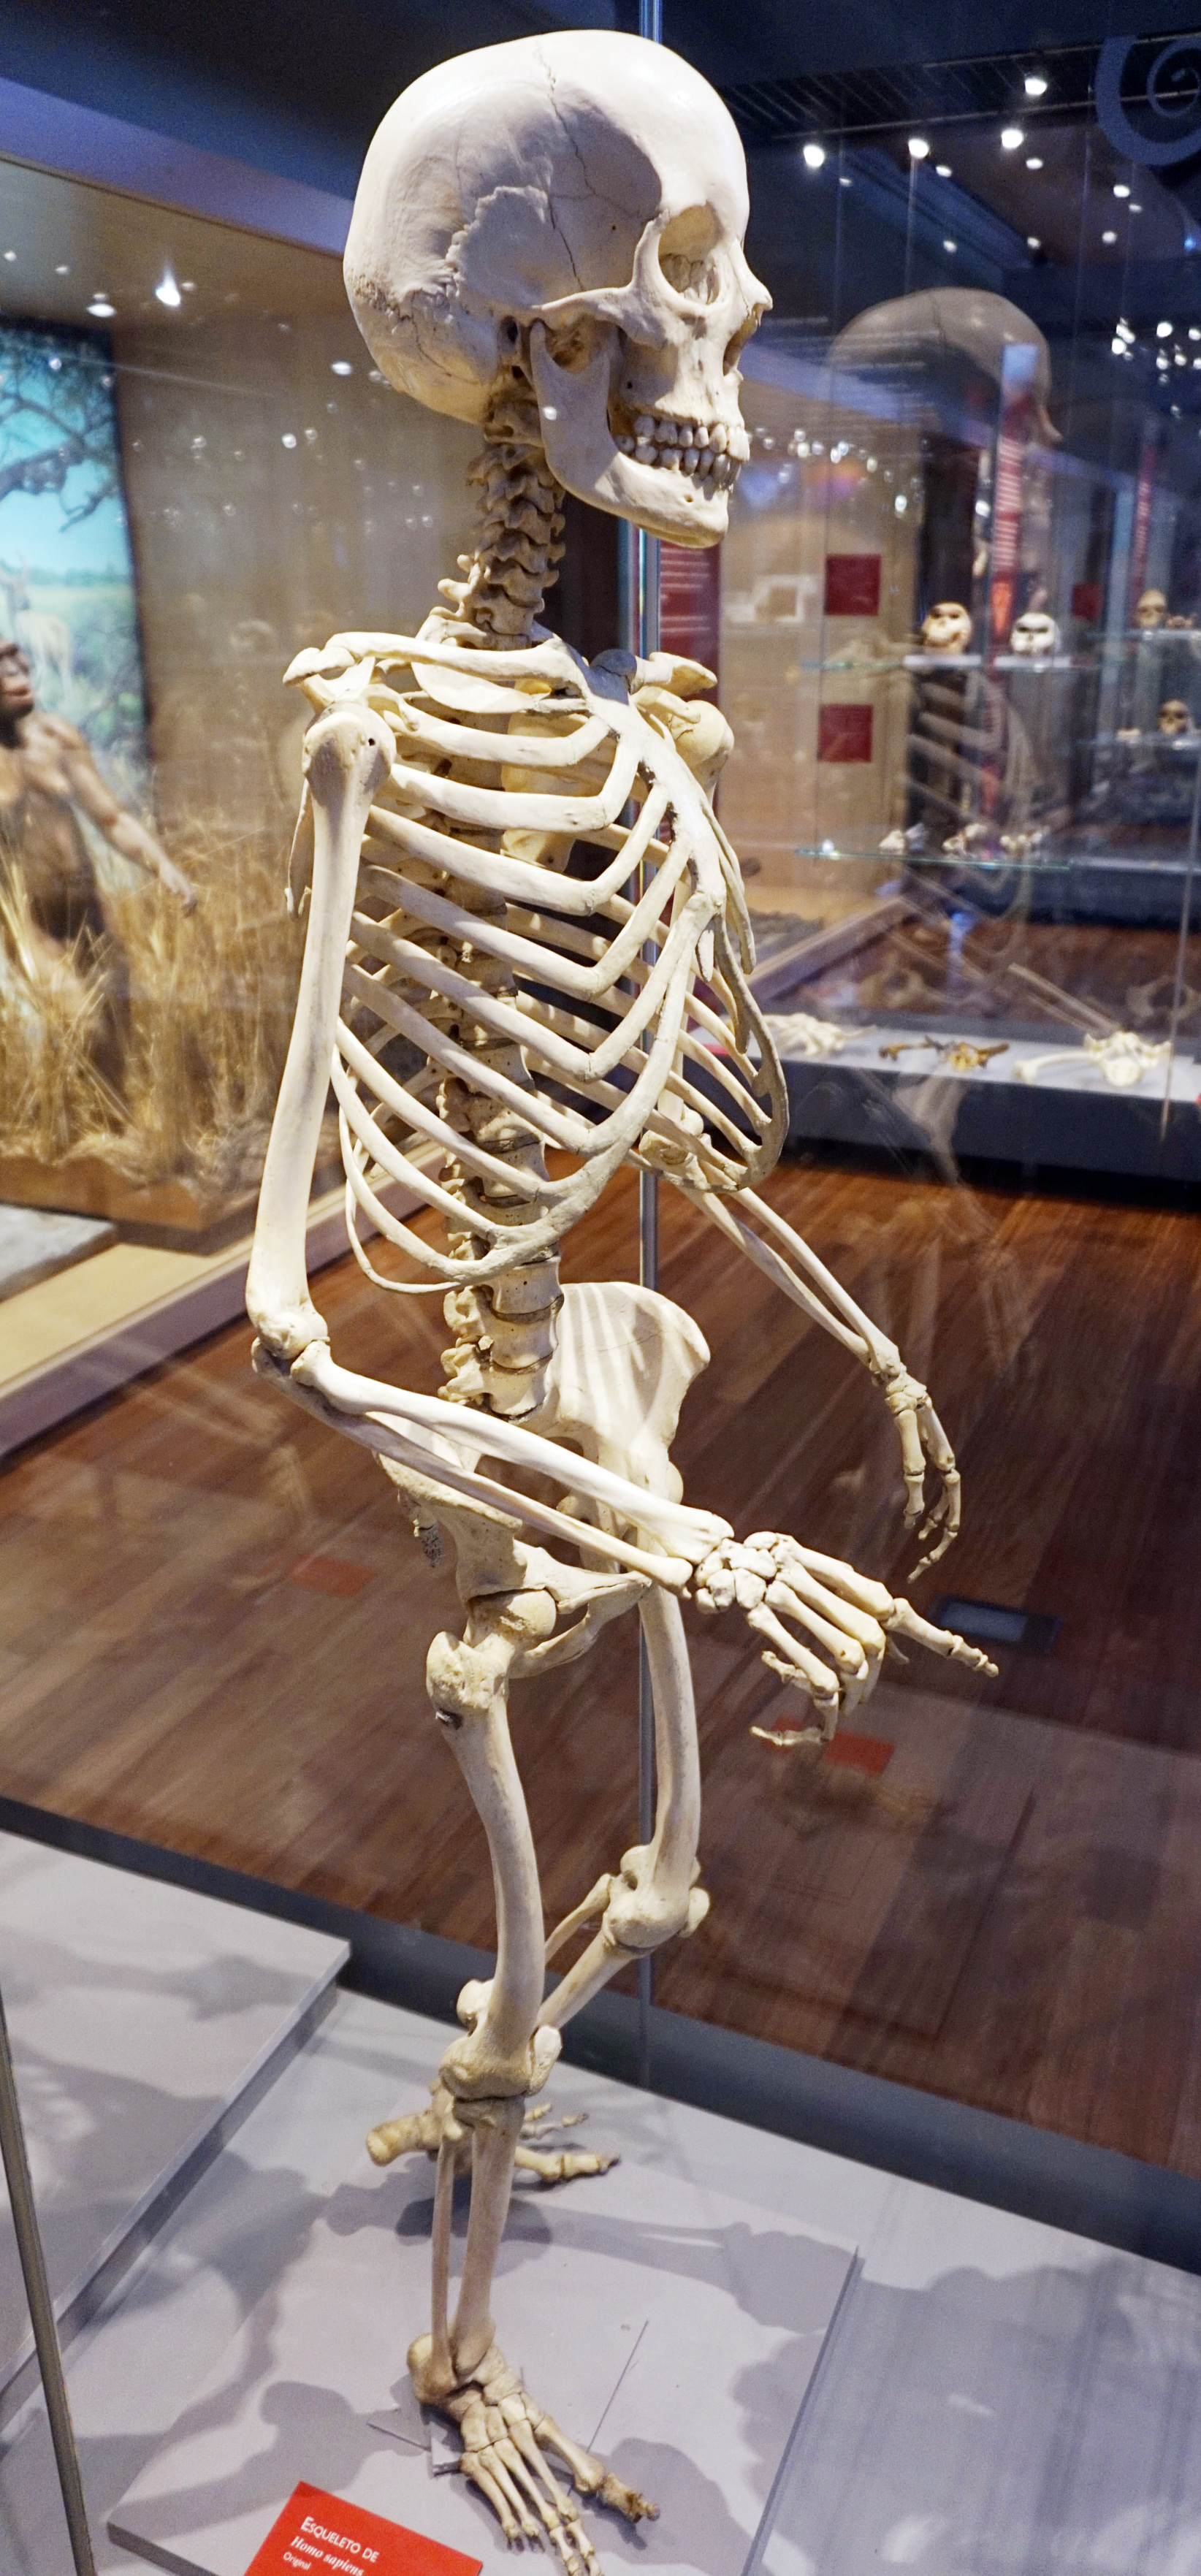
The Latin term os means bone, while textus osseus refers to osseous tissue. The tissue contains cells and vessels as well as matrix, and it changes over time. A clean white skeleton display does not show the blood supply or marrow and can encourage the mistaken impression that bone is an inert scaffold. A useful educational figure pairs the whole bone with a magnified view containing matrix, cells, and a vascular route. When discussing density, retain this living-tissue perspective. Mineral content is important, but it is one component of a structure that continually responds to its biological and mechanical environment.
Cortical and trabecular architecture explain regional differences
Cortical bone, substantia compacta, forms a relatively dense outer structure, whereas trabecular bone, substantia spongiosa, contains a network of plates and struts around marrow spaces. These arrangements occur in different proportions in different skeletal regions. The femoral shaft, vertebral body, and skull therefore cannot be understood as identical containers of mineral. A measurement at one site reflects that site's structure and cannot be assumed to describe every bone equally. The internal organization is introduced in OpenStax: Bone structure. A trabecular pattern is a functional architecture, not simply a sign of disease.
The terms porous and spongy can be confusing outside anatomy. Normal trabecular bone has spaces, and those spaces support marrow and contribute to an efficient structure. A picture showing a lattice should not automatically be labeled osteoporosis. To illustrate bone loss, a diagram must clearly distinguish a normal teaching schematic from a second hypothetical schematic with altered thickness or connectivity. Even then, it is not a calibrated measure of a patient's tissue. Students should examine whether the figure demonstrates actual imaging, a histological section, or an explanatory model. Each can teach architecture, but they provide different kinds of evidence.
Remodeling makes density a changing biological result
Bone remodeling involves coordinated removal and formation of tissue. Osteoclasts resorb bone, osteoblasts form new matrix, and osteocytes participate in sensing and signaling within the tissue. The activity is not random destruction followed by emergency repair; it is part of normal maintenance. When formation and resorption become imbalanced over time, mineral density and architecture can change. NIAMS: What is bone? describes the cellular participants in remodeling. Their names are useful to learn together because similar-looking words describe quite different activities. An osteoblast is not an immature osteoclast, and an osteocyte is not merely a passive space filler.
This turnover explains why a density result has a time dimension. A scan captures a measurement at a particular visit, not the entire history of the skeleton. Earlier growth, later hormonal changes, periods of reduced loading, nutrition, and illness can influence the current tissue. A serial measurement may help reveal a trend, but the apparent difference must also be evaluated against the precision of the method. The biological concept and the measurement concept should remain separate: bone can change gradually while the test contains some unavoidable variation. Combining both ideas prevents students from treating every small numerical shift as a definite biological event.
Growth, peak bone mass, and later-life change
The skeleton changes substantially during growth. Bone size, shape, mineral acquisition, and tissue organization develop together, so childhood density cannot be interpreted as though a child were simply a small adult. Later, bone mass can decline, and some physiological transitions affect the balance of remodeling. Postmenopausal changes are an important example, but people differ in their life histories and risk factors. Age alone does not reveal the density of a particular person's bones. NIA: Osteoporosis explains the relevance of bone loss and fracture risk in later life.
A good patient explanation avoids inevitability. Describing osteoporosis as a possible disease of weaker bone is different from implying that all older people must have fragile skeletons. Likewise, one body shape or level of visible fitness does not establish a density result. Healthcare teams should use documented findings rather than impressions when communicating about skeletal risk. Students can draw a conceptual life-course curve to show that bone acquisition and loss occur over time, but it should be labeled illustrative and should not invent precise ages or universal rates. The curve represents a teaching idea, not a prediction of an individual's future measurement.
What central DXA actually measures
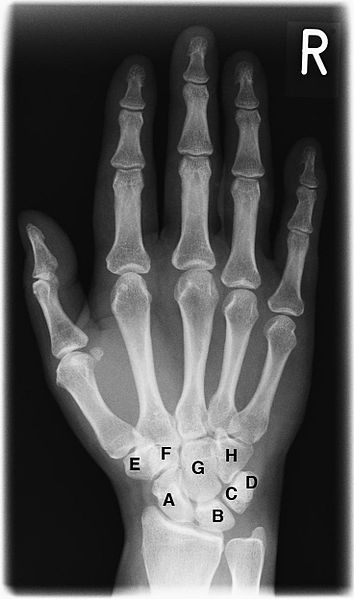
Dual-energy X-ray absorptiometry, abbreviated DXA, is a common method for assessing bone mineral density. Central DXA commonly evaluates the hip and lumbar spine, which are important regions for fracture assessment. The instrument estimates mineral content relative to the projected area, yielding an areal density usually reported in grams per square centimeter. It is not a direct three-dimensional measurement of the amount of mineral in every cubic centimeter of bone. NIAMS: Bone mineral density tests introduces the test, while ISCD official adult positions specifies reporting terminology and measurement standards.
This two-dimensional feature helps explain why bone size and technical factors matter. A scan is an analytical measurement derived from images and reference data rather than a simple photograph of strength. Patient positioning, selection of the region of interest, and structural changes can affect the result. A visual educational example can show a projected bone outline with mineral content divided by area, using hypothetical numbers and clearly identifying the calculation as invented for teaching. Staff assisting with scheduling or preparation should follow the imaging service's instructions. The anatomy lesson explains the measurement; it does not replace the local procedure or the professional interpretation of the report.
T-scores compare with a young-adult reference
A T-score expresses how far a measured density lies from a young-adult reference mean, using the reference population's standard deviation as the unit. It is not a percentage and it is not a count of missing calcium atoms. In the population to which the conventional classification applies, a T-score of minus 1 or above is categorized as normal density; below minus 1 but above minus 2.5 is low bone mass; minus 2.5 or below meets the densitometric osteoporosis threshold. These boundaries require context. T-scores are preferred in postmenopausal women and men aged 50 or older as explained by NIAMS.
For a simple calculation, suppose an illustrative young-adult reference mean were 1.00 grams per square centimeter and its standard deviation were 0.10. A hypothetical density of 0.80 would be two standard deviations below that mean, giving a T-score of minus 2.0. These are invented teaching values, not a manufacturer's reference database or a diagnostic example for a real patient. The exercise shows why a score cannot be reconstructed accurately without knowing the relevant reference data. It also shows why a negative sign means below the reference mean rather than physically negative bone. The actual clinical report must be interpreted using the site's valid measurement and reference standards.
Z-scores answer a different comparison question
A Z-score compares density with an age-appropriate reference rather than a young-adult benchmark. In premenopausal women and men younger than 50, ISCD prefers Z-scores for reporting. A Z-score of minus 2.0 or lower is described as below the expected range for age; a value above minus 2.0 is within the expected range for age. This terminology should not be casually replaced with the adult T-score categories. In particular, ISCD states that osteoporosis cannot be diagnosed in men under 50 from bone density alone. These distinctions are set out in the official positions and should remain attached to the correct population.
The comparison is useful because two different questions can produce different scores from the same measured density. How does the person compare with a young-adult reference is not the same question as how they compare with an age-related reference. Neither score directly measures how hard a person can fall before a fracture occurs. Students should write the question beside the score in their notes, rather than memorizing only a threshold. When explaining a report, staff can name the score and its reference purpose while leaving diagnostic conclusions to the responsible clinician. This approach avoids treating the two abbreviations as interchangeable laboratory labels.
Serial scans, precision, and clinically meaningful differences
Repeated scans are often used to evaluate change, but measurement variation must be distinguished from a true trend. The least significant change is a statistical concept based on the precision achieved by the service; it is not one universal percentage that applies to every scanner and every measurement site. Comparing a new result with an earlier one also requires attention to equipment and analysis conditions. A report may identify whether the scans can be compared directly and whether a difference exceeds the established precision limit. The standards for quality control and follow-up are discussed by ISCD.
For a purely mathematical illustration, a hypothetical density changing from 0.800 to 0.816 grams per square centimeter is a two percent increase because the difference of 0.016 is divided by the starting value of 0.800. That arithmetic does not tell us whether the change is statistically significant or clinically important. It should not be used to judge an actual treatment response. A learning chart can place the two numbers beside an explicitly fictional precision band to demonstrate the idea. The essential habit is to ask whether the measurement process supports the comparison before concluding that bone has definitely become stronger or weaker.
Fracture risk includes more than a density category
Fracture risk is influenced by the strength of bone and by the circumstances that load it. Previous fractures, age, relevant illnesses, medications, and other clinical factors can matter, while balance and the environment influence the chance of falling. A density category therefore does not summarize every element of risk. This is why a clinician may consider a broader history and examination when interpreting a scan. NIAMS describes osteoporosis in terms of both density and structural change. For a person receiving care, the important concern is the clinical consequence of a fracture rather than the appearance of a colored zone on a chart.
In older-person care, record falls, changes in mobility, and new pain or difficulty with familiar activities according to the team's procedures. These observations should not be dismissed because an old scan was normal, nor should a low density result be used to assume that every movement is unsafe. Support should follow the person's assessed needs. The distinction between a risk factor and a present injury is particularly important: a density measurement concerns skeletal vulnerability, while a new symptom may require a separate assessment. Good communication names both the relevant historical information and the current observation without merging them into an unsupported diagnosis.
From an anatomy lesson to a clear explanation
A concise explanation of a bone density result should identify the measurement site, the unit, the score type, and the clinical context. A student can practice by explaining why the hip and lumbar spine are not identical regions, why a T-score is dimensionless, and why serial values require a quality-controlled comparison. This practice is more useful than repeating that denser is always better. The concept of bone quality includes organization and material properties, and an unusual measurement may need clarification rather than immediate reassurance. Educational diagrams should give each quantitative label a unit and should distinguish observed data from hypothetical examples.
Nutrition and physical loading contribute to bone physiology, but an anatomy guide should not prescribe a personal supplement dose or exercise program from one number. OpenStax: Bone physiology provides the general biological framework. Clinical advice depends on the person's health, function, and professional assessment. The durable learning point is that a scan measures an aspect of living tissue. Understanding cells, matrix, architecture, and measurement allows medical students and healthcare teams to discuss bone density accurately, ask better questions about a report, and support decisions without reducing skeletal health to a single score.
Anatomical Latin: quick reference
| Latin term | English meaning |
|---|---|
| Textus osseus | Bone tissue |
| Substantia compacta | Compact bone |
| Substantia spongiosa | Spongy / trabecular bone |
| Medulla ossium | Bone marrow |
Sources and image credits
Sources reviewed on 9 October 2026. Counts, estimates, study statistics and hypothetical calculations retain their context in the text.
- What is bone?
- Bone density tests
- Official adult positions
- Osteoporosis
- Calcium
- Bone structure
- Bone physiology
- Older adults and osteoporosis
Explanatory prose and SVG graphics are original. Photograph authors, source records and licenses are credited beside each image. Catalog illustrations provide educational context; anatomical facts are supported by the linked sources.